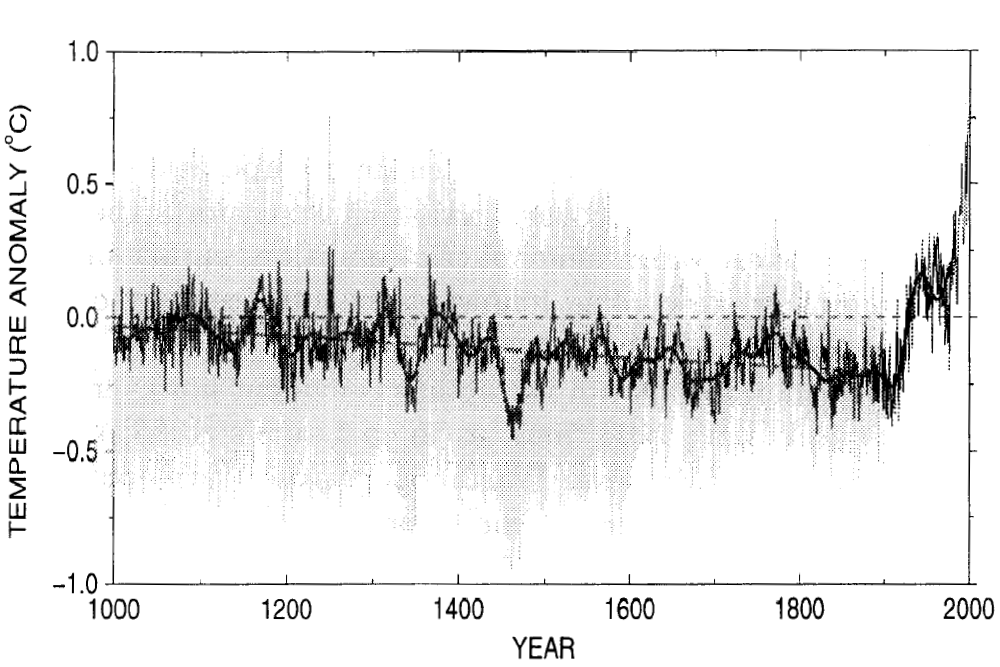
Following is a simplified description of the main statistical error found with the “hockey stick” graph of temperatures during the past millennium.
Michael Mann, Raymond Bradley, and Malcolm Hughes are three respected scientists in America. In 1998 and 1999, they jointly published some research on how temperatures have changed during the past millennium. According to their research, the temperature in the Northern Hemisphere was roughly constant during the millennium, up until the twentieth century; then, in the twentieth century, temperatures increased very substantially. Their graph of hemispheric temperatures is shown below.

The graph was dubbed the “hockey stick”, because of its shape. It became an icon for many people concerned about global warming, and it was prominently featured in the 2001 report from the Intergovernmental Panel on Climate Change.
Stephen McIntyre is an independent researcher. Working with Ross McKitrick (an economist), he found invalidating errors in the way that Mann, Bradley, and Hughes had done their work. The most important statistical error is described below.
Consider the following two sets of numbers.
Set A: 7, 8, 9, 10, 11Set B: 2, 6, 9, 12, 16
For each set, the average is 9. Yet the two sets are not the same. In particular, we can see that Set B has more variation than Set A. Here, “variation” is an intuitive concept. Statisticians, though, have developed a way to quantify variation. They call this quantity the variance of the numbers. The variance is greater for Set B than it is for Set A.
One of the first steps in calculating variance is to find the difference between each number and the set's average. For set A, those differences are as follows (omitting signs): 2, 1, 0, 1, 2.
Suppose that we compute those differences again, but instead of finding the difference with the average, we find the difference with some other number. Here is an example, using 4 instead of 9: 3, 4, 5, 6, 7.
Of course, these differences are not the same as the previous differences. And if we calculated the variance using these differences, the variance would almost always be incorrect. That, in essence, is the error made by Mann, Bradley, and Hughes. In other words, the researchers calculated the variance of some numbers, but in computing the differences, they used a number that was not the average. (This error is sometimes called “decentering”.)
Understanding the main statistical error is thus straightforward. Understanding how this error leads to spurious hockey sticks is more involved.
It should also be noted that there are other important problems with the way in which Mann, Bradley, and Hughes did their work; for details, see the listed works of McIntyre & McKitrick and Wegman et al. For more information about the hockey stick generally, see the listed book by Montford.
See also
| • | Remarks on Keenan [Theor. Appl. Climatol., 2007] |
| • | Tree-ring data at Queen's University Belfast—climatology |